
This March, I got to present at the NYC Monthly Music Hackathon about my experiments using stenography and coding to enhance accessibility of auditory information for those with hearing loss who use real-time captioning as a form of accommodation.
Problem
While sign language interpreters can use their body and expressive, animated signing to convey the tone, rhythm, and various other qualities of music, real-time captioners are comparatively limited in their expressive capabilities. Deaf attendees who primarily use spoken language typically must rely on a combination of their residual hearing, vibrations, cues from the performer or audience members, and parenthetical descriptions inserted by the captioner to piece together a mental representation of what’s being heard.
Here’s a short clip of what live captioning looks like in action:
Despite having provided real-time captioning services for almost six years now, this was something I hadn’t considered at all until I was hired by Spotify to caption their February Monthly Music Hackathon. A deaf attendee, Jay Zimmerman, approached me and requested that I describe the audio segments during the demo portion as best I can. As a musician who had lost his hearing later in life, Jay wanted and appreciated a greater level of access than the simple music note, as often seen in TV closed captions, or simply the lyrics on screen. So I did the best that I could:
![On screen, it shows a bunch of dialogue and then parentheticals for [ Big Room House/EDM ] and [ Tiësto, Martin Garrix - "The Only Way Is Up" ].](http://blog.stanographer.com/wp-content/uploads/2018/04/C4_7WA5XAAEf-A8.jpg)
Brainstorming and Thought Process
A while back, I wrote a post on my project, Aloft. In short, it’s a cloud based caption delivery app which enables participants to access stenographers’ live transcription output on any Internet-enabled device with a modern browser. Its main use case was originally for those participating in events or lectures remotely:
But I actually use Aloft in all of my captioning work, including those that are on site where I hook up to a projector, drag the participant view page over to the monitor, and display it full screened like so:
Well, one of the great benefits of working with software you wrote yourself is that, as you encounter different needs, you are free to modify your tools to meet them. In fact, one of the reasons I created Aloft was because of how anoyingly restrictive and unintuitive commercial legal-transcription viewing platforms typically are with respect to seemingly simple things like being able to change the font size or the color palette.
So that got me thinking…
What if we could simultaneously convey the transcription of spoken content in addition to some visual representation of the audio?
Initial Research
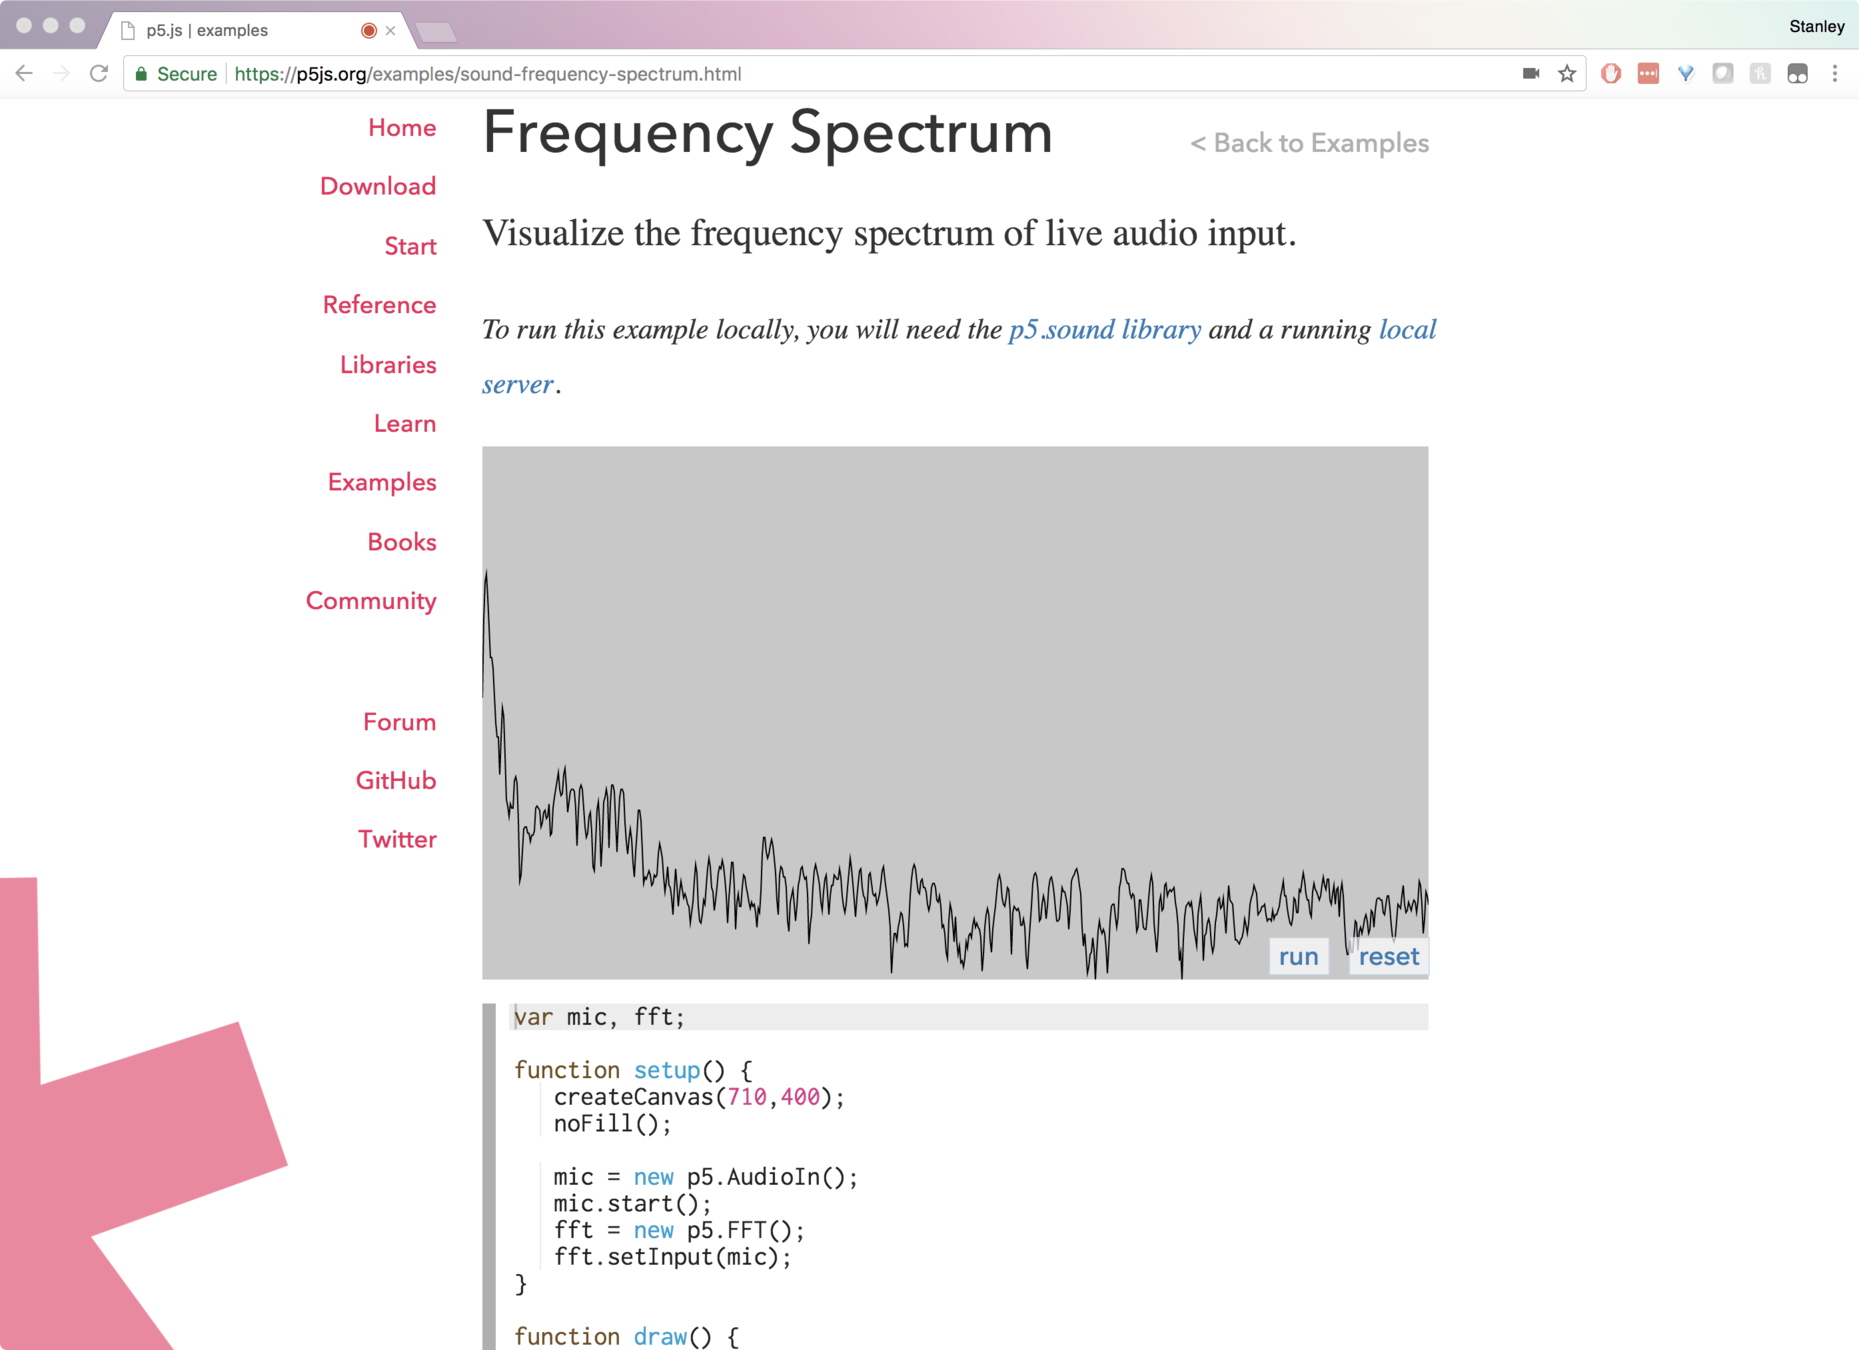
At first, I didn’t know where to start since, at the time, I hadn’t really dealt with computer audio processing at all so I began with researching different JavaScript packages (since it needed to be web compatible and I didn’t really want to deal with having to run code through an interpreter). I came across a package called p5.js, which a lot of the folks at the hackathon seemed to have either heard about already, or used in the past. The Frequency Spectrum add-on seemed pretty promising.
Implementation
So I created it a special route in Express so it would only live on a page that I could point the browser to only during the occasions I need it. We don’t want all those extra scripts loading when I’m doing just normal captioning!
app.get('/soundbar/:user/:event', function(req, res) {
	Event.findOne({'user': req.params.user, 'event': req.params.event},
	function(err, event) {
		if(err) {
			throw err;
		} else {
			res.render('watch-soundbar', {
				'user': req.params.user,
				'event': req.params.event,
				'marker': req.params.marker
			});
		}
	});
});
So now, I would I would load the libraries only if I went to localhost:4000/soundbar/stanley/monthly-music-hackathon.
Then, it was just a matter of importing the libraries into the view, and initiating p5 via the code provided on the demo page with some minor modifications.
var mic, fft;

function setup() {
	let canvas = createCanvas(windowWidth, windowWidth/5);
	canvas.parent('waveform');

	noFill();

	mic = new p5.AudioIn();
	mic.start();
	mic.amp(10);
	fft = new p5.FFT();
	fft.setInput(mic);
}

function draw() {
	background('#{bgColor}');
	stroke('#{fontColor}');
	strokeWeight(3);

	var spectrum = fft.analyze();

	beginShape();

	for (i = 0; i<spectrum.length; i++) {
		vertex(i, map(spectrum[i], 0, 255, height, 100) );
	}

	endShape();
}

function windowResized() {
	resizeCanvas(windowWidth, 250);
}
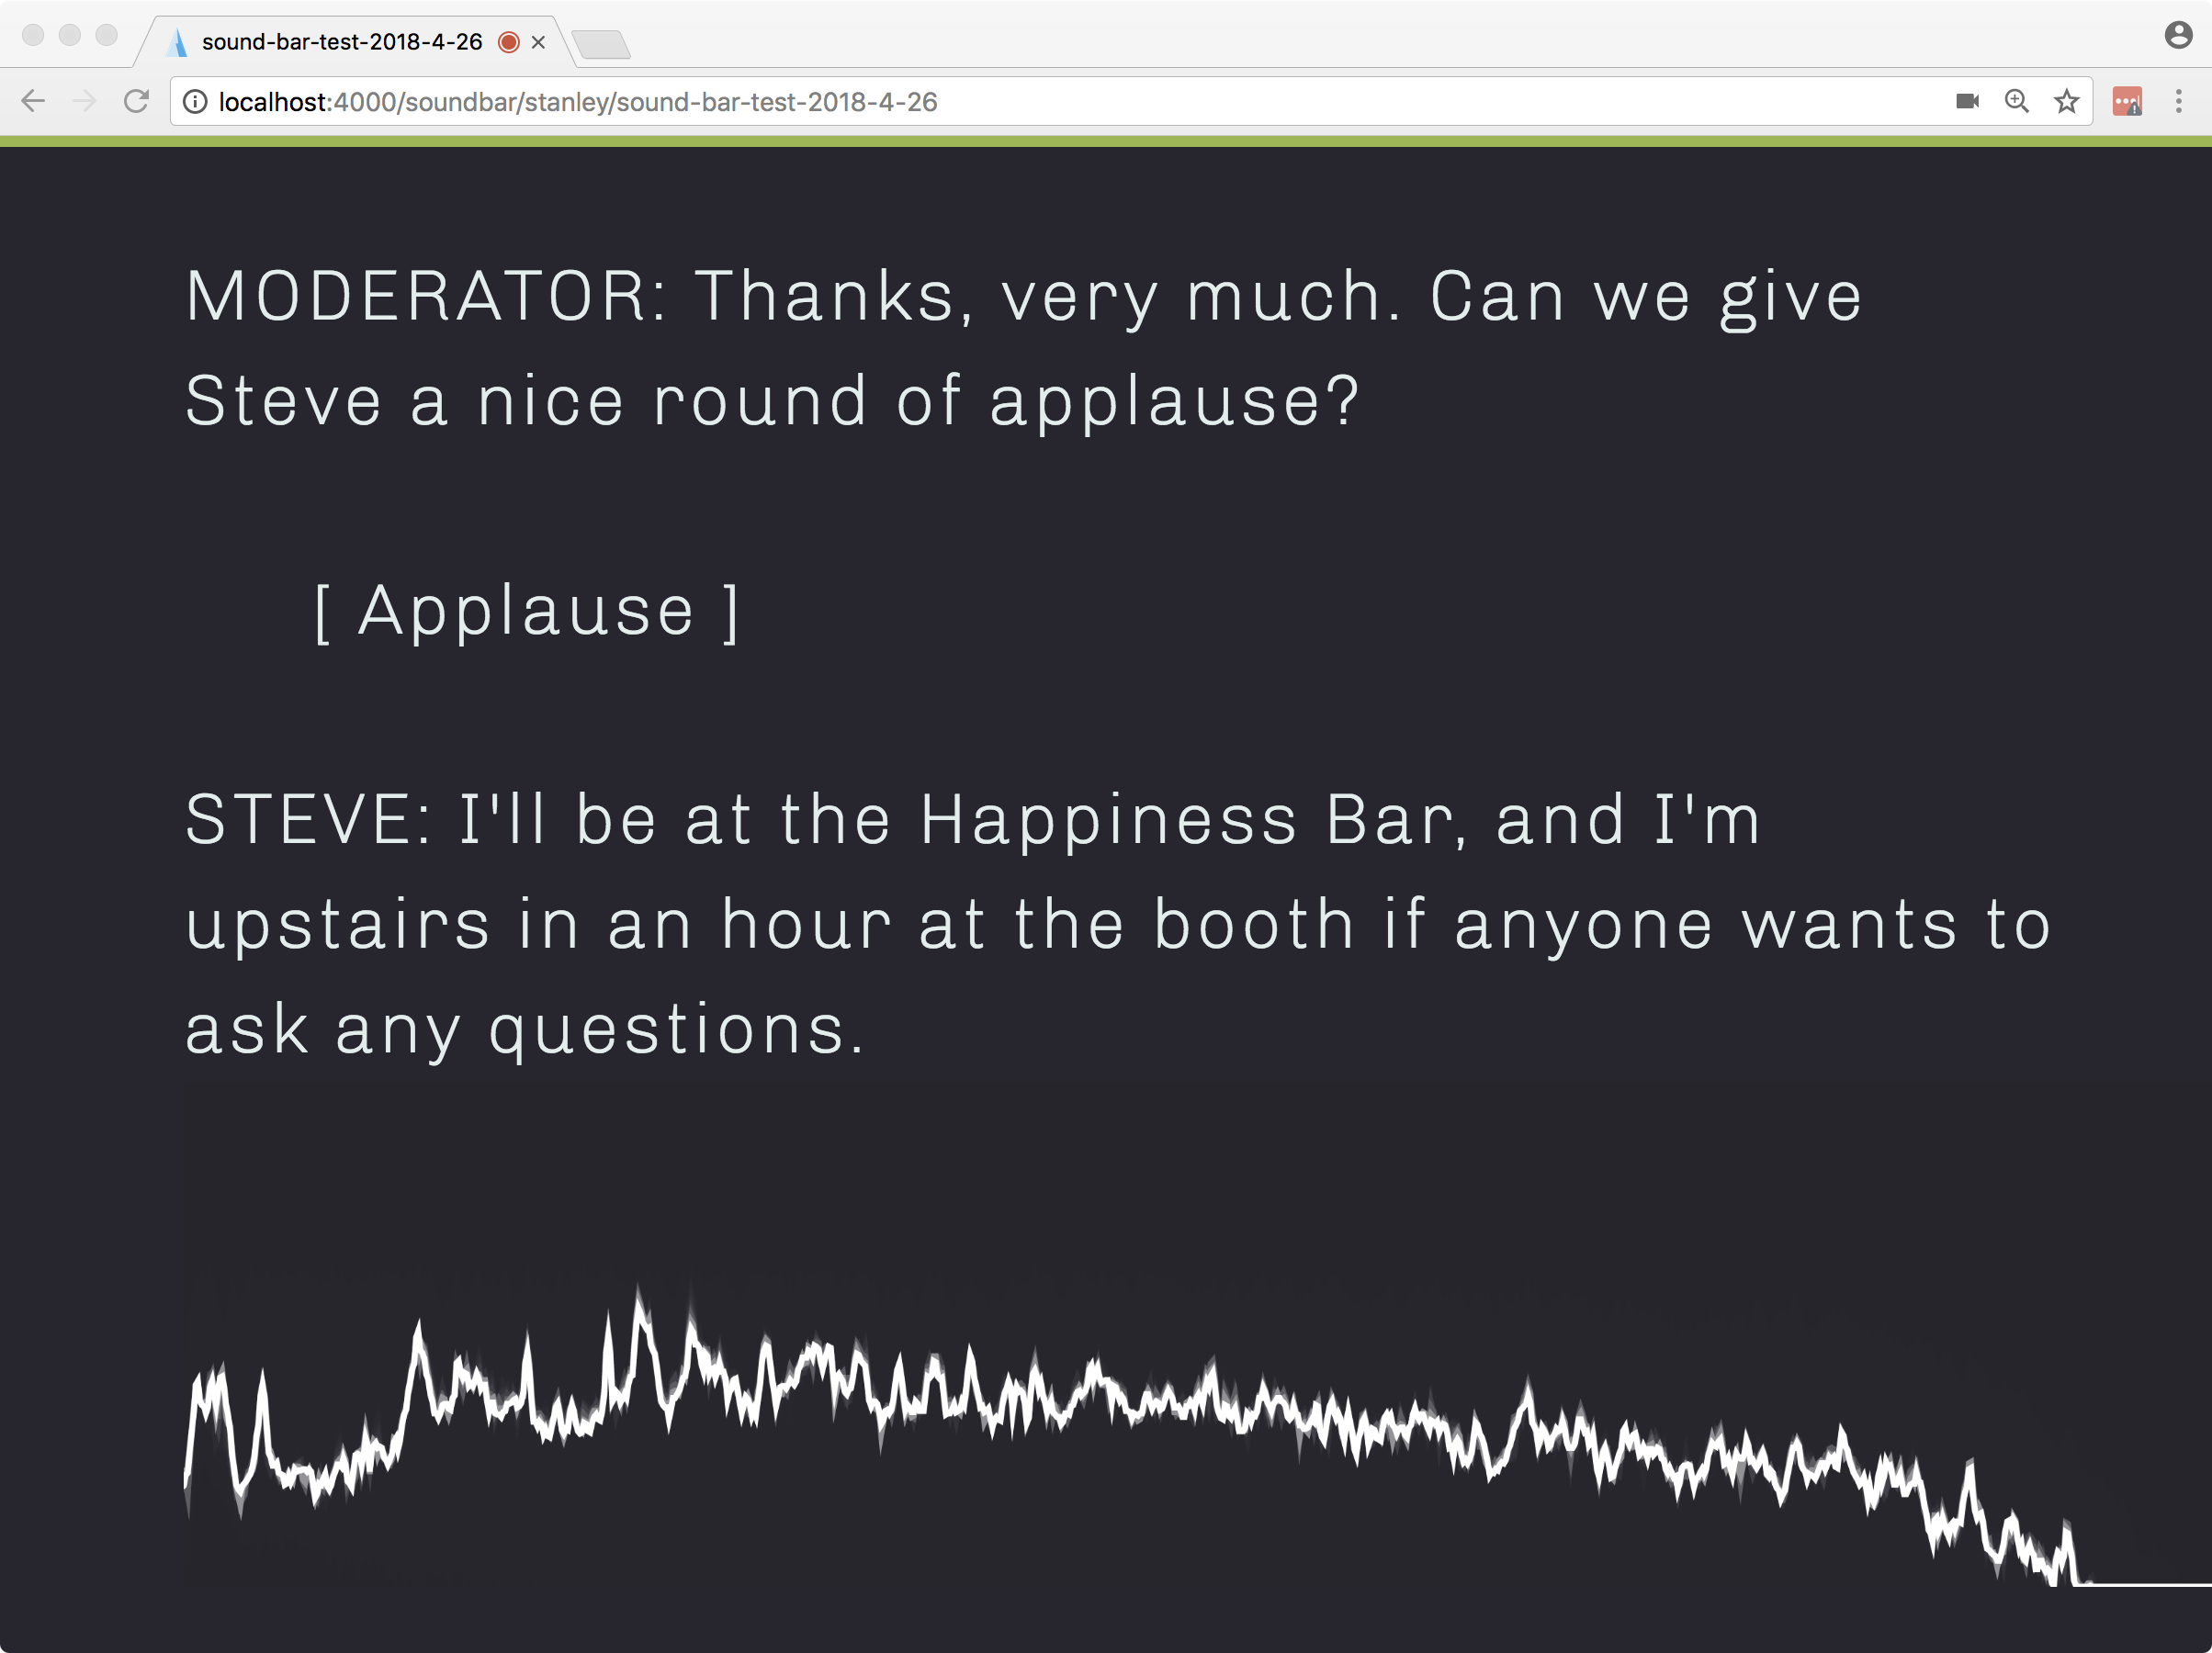
A few changes I made were: I modified the canvas width so that it automatically calculates the height and width based on the parent window, so it would always be proportional to the size of the size of the captioning screen. Since we don’t know what the foreground and background colors are, as they’re dynamically set by an Angular service, I passed those in as variables that are pulled from local storage via an Angular service, and sent to the controller. Finally, I passed in the div to which it should display and we have a working audio waveform at the bottom of the screen!
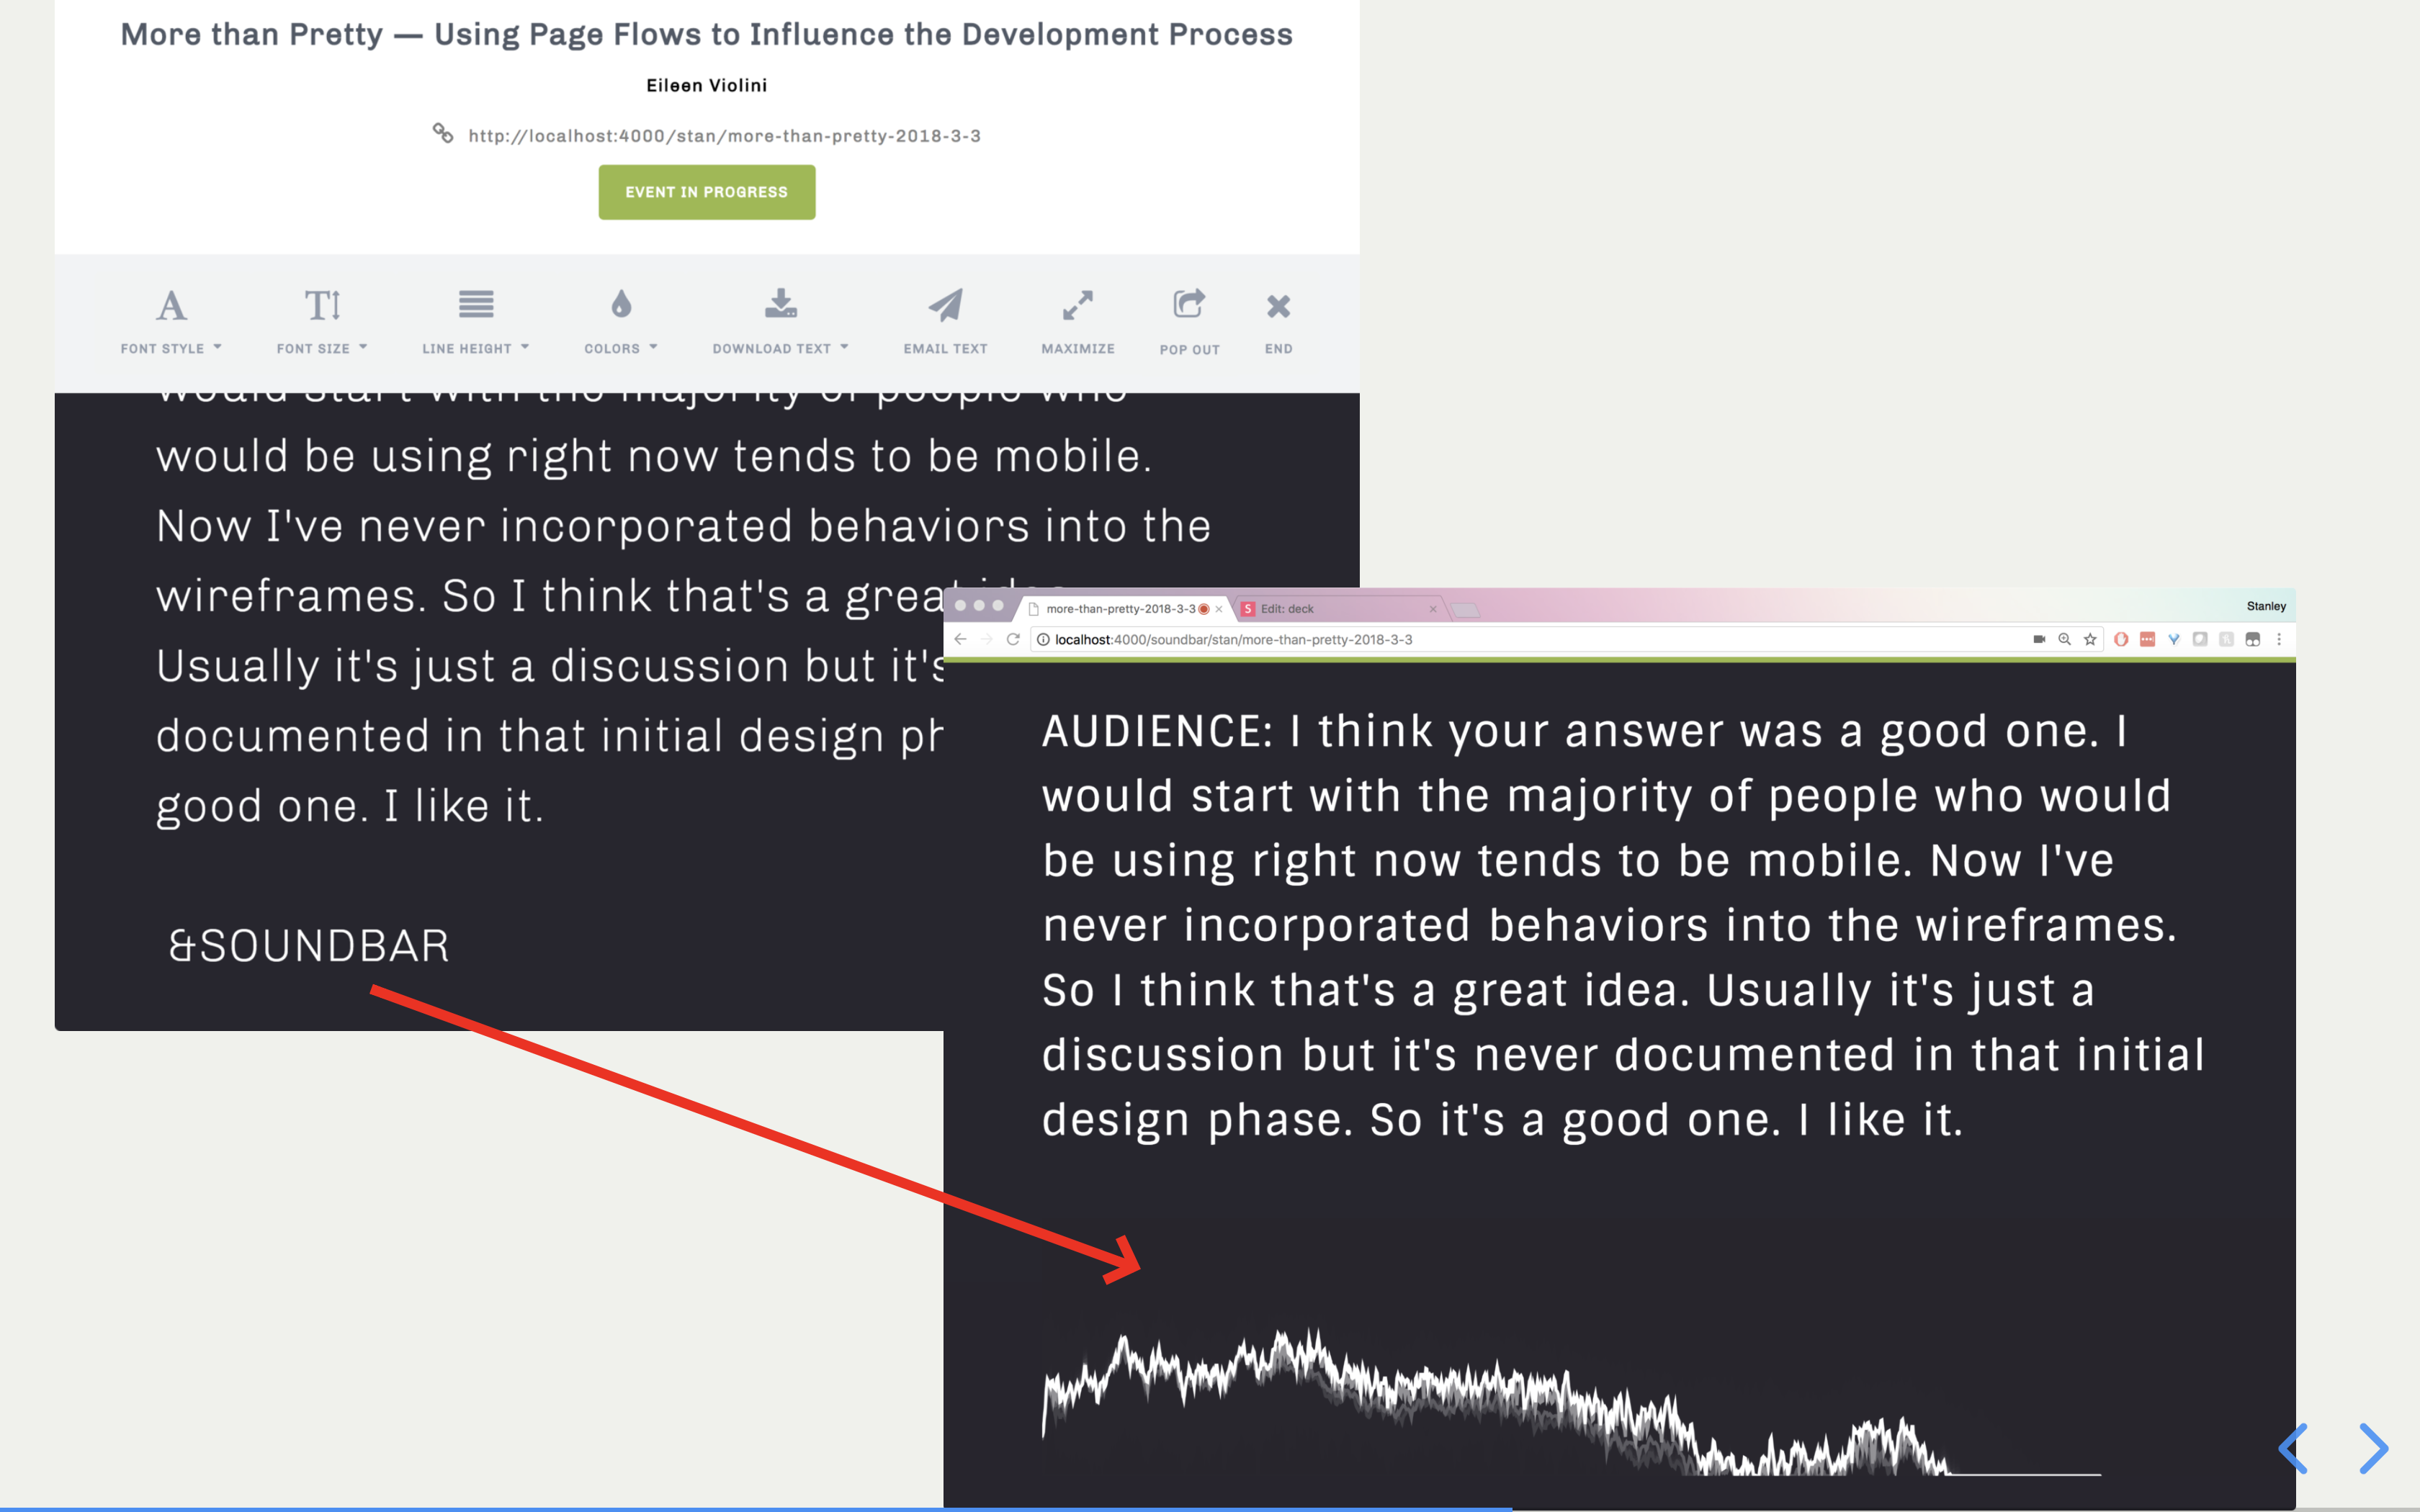
But, wait a minute. What if I don’t want to see the “soundbar” all the time? What if I only want it to be displayed when appropriate, as in during a live musical demo or performance? Well, why don’t I create a command that I can invoke from the steno machine that would turn it on and off? So I arbitrarily decided that &SOUNDBAR would be the flag I would use to turn the soundbar on and implemented it like so:
// If the number of &SOUNDBARs is even, toggle between show and hide.

if ((text.match(/&SOUNDBAR/g) || []).length % 2 === 0)  {
	soundbar.style.display = 'none';
	captionArea.style.paddingBottom = '4rem';
} else {
	soundbar.style.display = 'inherit';
	captionArea.style.paddingBottom = '0rem';
}
So essentially, every time the backend receives text, before it modifies the DOM, it uses a regular expression to check to see whether the sequence of characters matches &SOUNDBAR, and if the number of &SOUNDBARs present in the transcript is odd, then display. If it’s even, hide it. Probably not the most optimal solution in that the microphone is activated and also performing the calculations in the background whether or not the soundbar is visible, but it works for now.
Now, the soundbar remains hidden until I choose to show it by writing SPWA*R on my steno machine, which spits out &SOUNDBAR in the transcript. As soon as I don’t need it anymore, I write SPWA*R again, the number of soundbar flags on the page is now even, and it hides the div.
An obvious drawback is that if the consumer wants a copy of the transcript, I would have to go back and delete all the occurrences of &SOUNDBAR but that’s a problem to solve for another day. Another problem is that p5 is always running in the background even when the div is hidden. This is a limitation of package itself, unfortunately, since I’ve encountered trouble loading it via some event handler as opposed to how it was designed to work: on page load.
A limitation that Jay pointed out was that, while the soundbar solution is great for visualizing instantaneous peaks, what’s loud or quiet at the current moment. It’s relatively poor at visualizing temporally, what’s going on. So I played around with another possible solution, this time using a different Web Audio-based package called Awesome Realtime Audio Visualizer in JS, HTML created by Will Brickner. His audio visualization spectrogram conveys the frequency on the vertical axis, time on the horizontal axis, and intensity through pixel brightness. When the visualizer is activated, a yellow line scans across the screen from left to right, drawing a spectrogram in real-time, giving one more of a temporal idea of the auditory content:
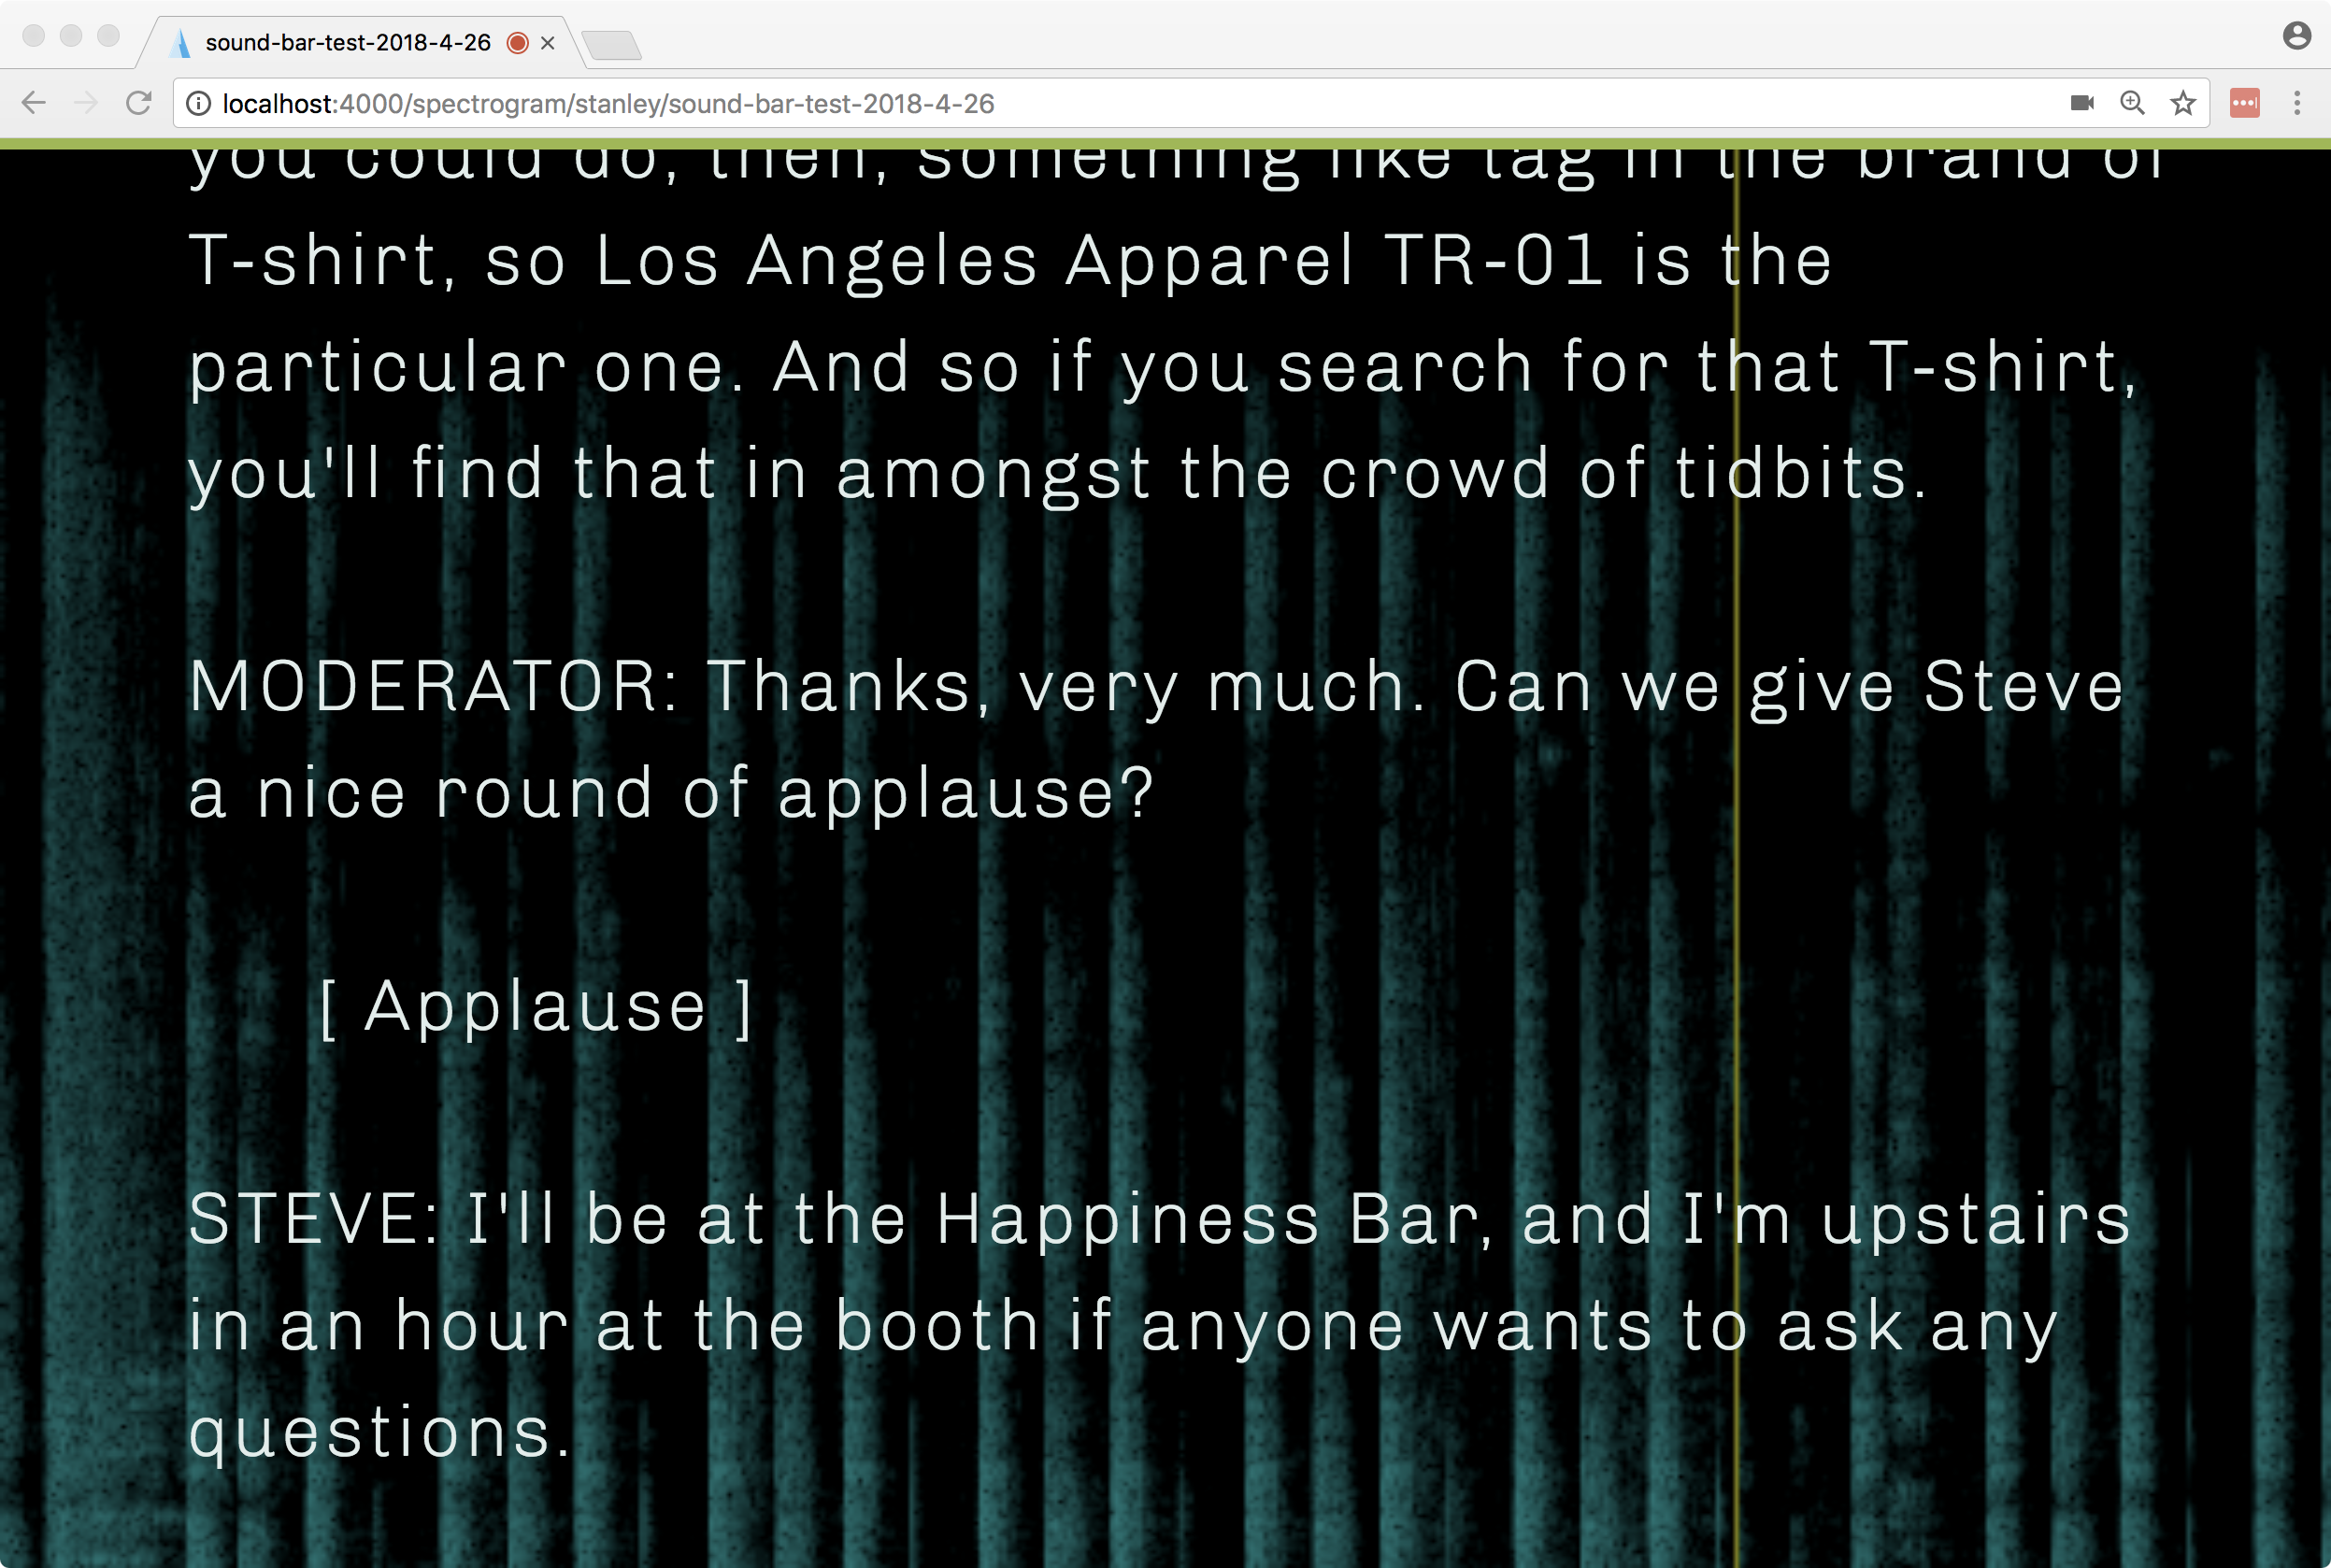
In contrast to the soundbar, this visualizer takes up the whole screen and becomes the entire page’s background. In the view, it lives as an HTML canvas object. As with the soundbar example, this implementation also has its own route (/spectrogram) and it also allows the captioner to turn the audio visualizer on and off depending on need.
Final Thoughts and Next Steps
The biggest challenge is really being able to convey enough depth to make the experience as immersive and inclusive as possible. While these two solutions are a great start, perhaps combining them somehow into one page would let the user benefit from both formats. Or better yet, incorporate a more-complex visualizer to allow for more bandwidth. As Jay puts it:
Both give a sense of amplitude and pitch, with amplitude being easier to perceive so we can see when sound is happening and whether or not it is soft or loud.
The issue with frequency/pitch information is how to make it clear and easy to decipher, which leads to linear vs exponential or logarithmic graphing.
Easiest way to comprehend pitch/frequency quickly is on the vertical, so high pitches are high and low pitches are low.
So what if we could harness a different axis like color to indicate volume, leaving the y-axis free for pitch and the x-axis to denote time? What if instead of a line or a sequence of bars, we had a 3D object that morphs and changes in size in response to different volumes or frequencies? But then that leads to the question: at what level of complexity would the visuals negatively affect the legibility of the captioning?